
Introduction
import { Aside, Card, CardGrid } from ‘@astrojs/starlight/components’;
PulsusDB is an open source observability data platform for logs, metrics, traces, and profiles. It is written in Rust, stores durable data in ClickHouse, and uses the OpenTelemetry Collector as its primary ingestion path.
What it changes
Section titled “What it changes”Most observability stacks make you operate separate databases for each signal or introduce a new query language. PulsusDB keeps the tools teams already know:
- send logs, metrics, traces, and profiles with OpenTelemetry;
- query metrics through the Prometheus HTTP API and PromQL;
- query logs with LogQL;
- query traces with TraceQL;
- store and process the data in ClickHouse;
- connect existing tools through optional compatibility endpoints.
Where it sits
Section titled “Where it sits”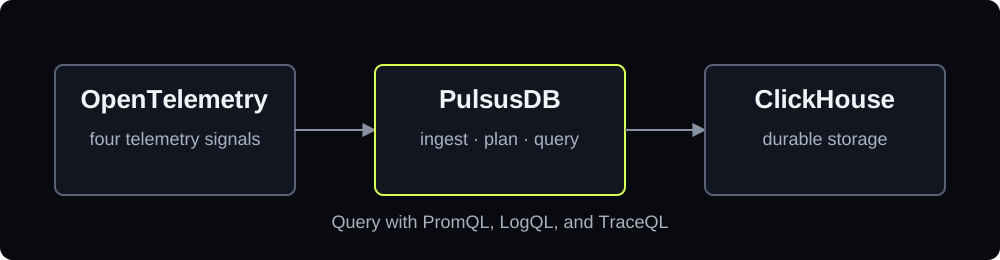
PulsusDB processes are stateless. ClickHouse holds all durable state and performs distributed storage and compute.
Runtime modes
Section titled “Runtime modes”| Mode | Responsibility | Start here? |
|---|---|---|
all |
Ingestion, query, and rule evaluation in one process | Yes — default for a first deployment |
writer |
Protocol decoding, validation, batching, and ClickHouse inserts | For independently scaled ingestion |
reader |
Query APIs, language front ends, and SQL planning | For independently scaled queries |